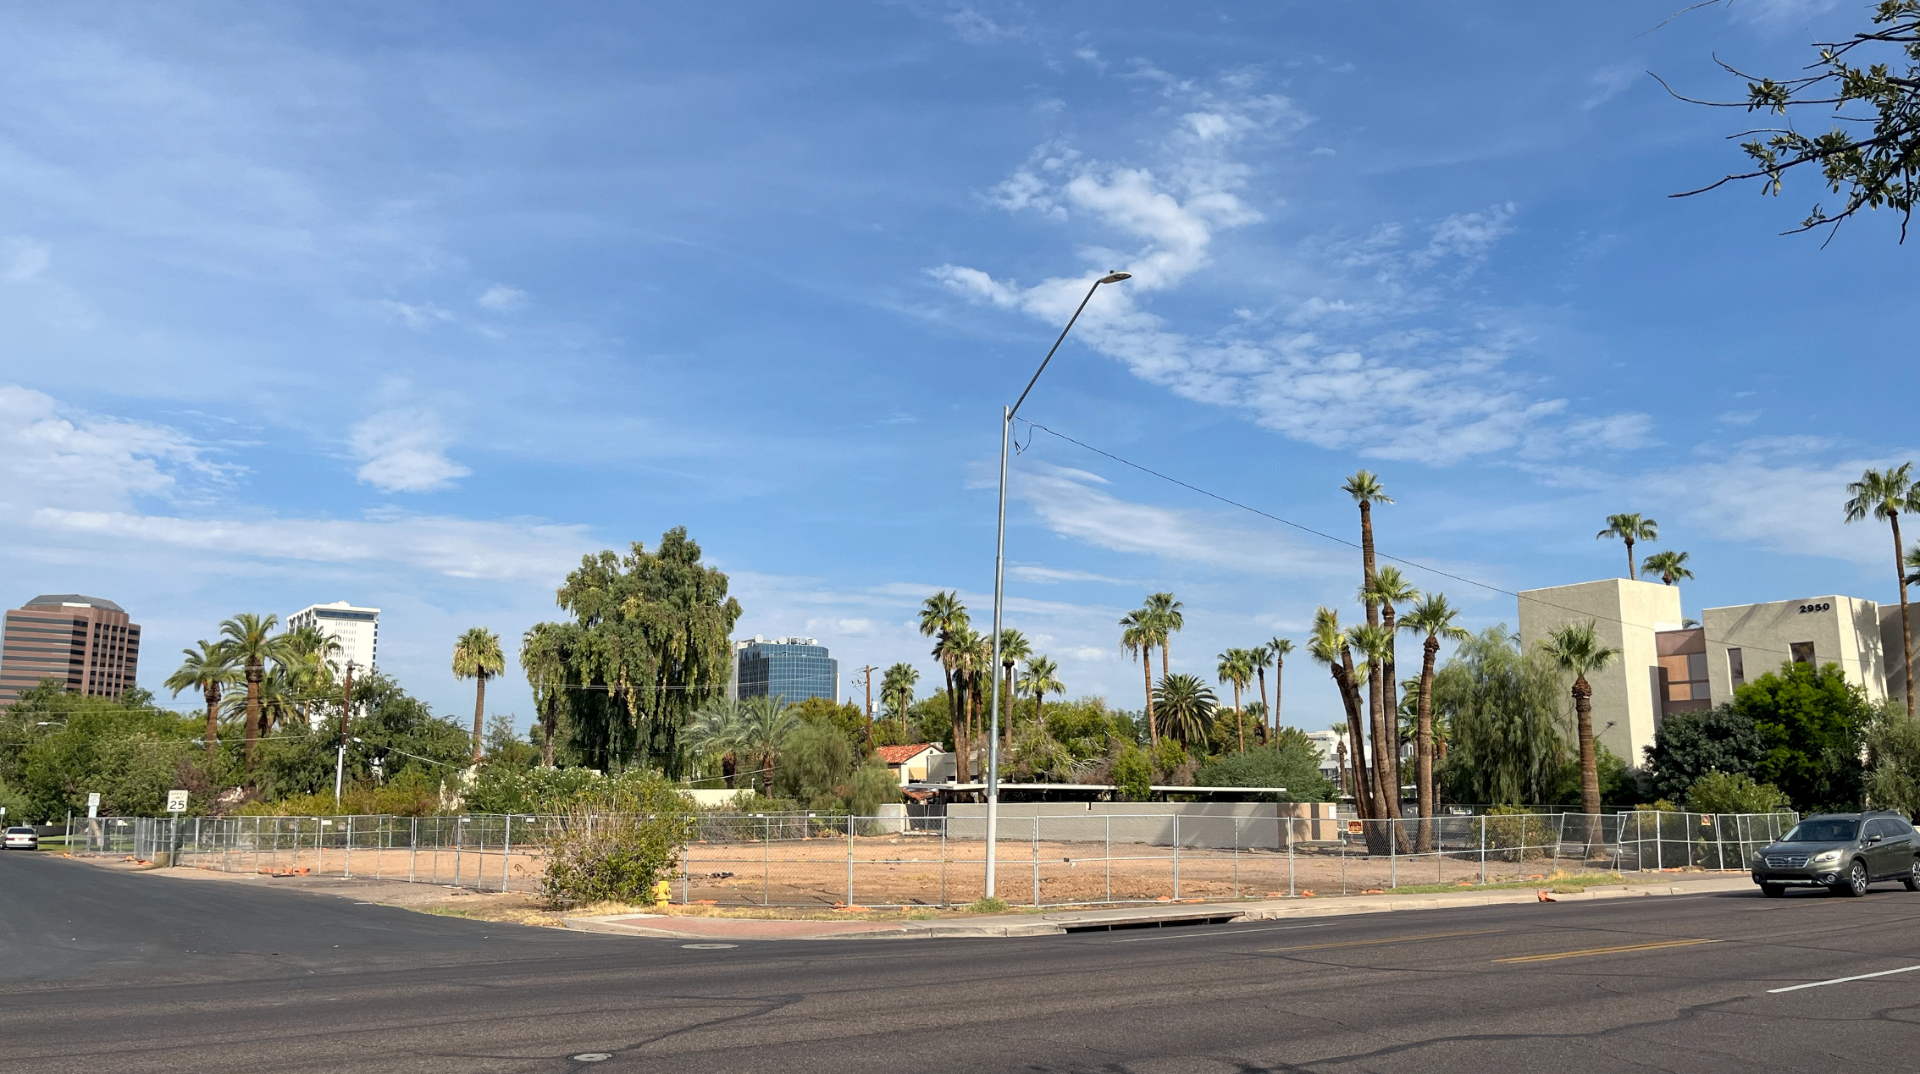
Site area
19,376
SF total parcel
Existing GBA
±8,000
single-story envelope
Stories
1
as-built condition
Status
Baseline
pre-feasibility
The operating system for real estate development.
For developers, capital partners, and land owners underwriting sites: ZFramework™ compresses feasibility from 45 days to 5 — so you know what a parcel is worth, what it can hold, and whether to walk, before significant capital is at risk.
Land moves in hours. Modeling it moves in months. That gap is where good deals get passed on, bad deals get green-lit, and capital sits idle waiting on a spreadsheet. ZFRAMEWORK™ closes the gap.
Feasibility studies that take 8–14 weeks while the deal slips away.
Architects, brokers, GCs, lenders — all working off different numbers.
By the time the model's built, the assumptions have already moved.
Yield-on-cost falls apart the moment one input changes.
From raw parcel to a defensible go / no-go.
Land, design, cost, and capital — linked. Change one, see all.
Re-underwrite a deal in minutes when the market moves.
Every chart and number is the same one your IC will see.
● Inputs sourced from municipal zoning APIs, CoStar-grade lease & sale comps, and live GC hard-cost benchmarks. Every number in the model traces to its source.
Adjust construction cost, rent, and exit cap rate. Watch yield-on-cost, stabilized value, and profit move across all three concepts simultaneously.
All three concepts, recalculated live. The highlighted concept has the best yield-on-cost under your current assumptions.
Illustrative model. Land cost held constant; hard and soft costs scale with the construction multiplier. Stabilized value derived from NOI ÷ exit cap. IRR proxy is directional — final underwriting confirmed at ZBUILD™ engagement.
We pull from county assessors, municipal planning departments, federal open data, and licensed broker comp sets. Today most figures on the site are curated snapshots with the last-verified date shown; live municipal GIS and assessor feeds are rolling in as we wire each county. Modeled outputs (yield-on-cost, land residual, IRR) are clearly labeled and link to methodology — not a source.
1Note: the information displayed relates to a Maricopa County sample project. Figures are illustrative of that sample and will vary by jurisdiction, parcel, and program.
Go / no-go with explicit kill criteria, capital exposure, and entitlement risk flags.
Linked inputs — change FAR, see IRR move. Yours to keep.
Three schemes in 3D — adaptive reuse, residential, commercial — with metrics overlay.
Sources & uses, debt sizing, equity multiple, sensitivity table.
● Engagements scoped per site. Single-site studies and multi-site subscription tiers — see pricing →
See the Platform →APN, address, sponsor thesis. Zoning, title, and parcel pulled automatically.
Entitlement envelope, allowable FAR, height, parking, setbacks resolved.
Three capital paths modeled in parallel — adaptive reuse, residential, commercial.
Hard cost, soft cost, capital stack, yield-on-cost, IRR and COC for each scheme.
Go / no-go recommendation with explicit kill criteria. Boardroom-ready.
These are the rules we won't bend. They're what make the platform reliable, and what make our work worth trusting.
If a number can’t be explained in a sentence, it doesn’t belong in the model.
Time kills deals. Every day of delay shows up somewhere in the IRR.
Design, finance, planning, and execution work in the project working seamlessly.
Every chart earns its place. Every metric points to a decision.
Institutions trust what they can verify, with complete confidentiality.
Land-led, time-sensitive. Underwrite faster than the broker can resend the deck — and walk before LOI when the math doesn't work.
Funds and family offices. Stress-test sponsor assumptions before equity is committed; benchmark against a comparable basis.
Position the parcel with a defensible feasibility envelope — three capital paths a buyer can underwrite the same day.
Align entitlement policy with what is actually executable at today's cost of capital.
Logistics and hospitality groups underwriting at speed across multi-site pipelines.
Two ways in. Submit a parcel for a free site read in 48 hours, or book a 30-minute call to scope a full 5-day engagement. No strings attached — your data stays confidential.